Case Study · 01
Redesigning the
Service Dependency Graph.
Helping engineers find their way through hundreds of API contract dependencies without losing their place.
The condensed version.
Problem: Specmatic Insights' Service Dependency Graph shows how up to 5,000 services connect through API contracts, with only 12–24 visible on screen at once — but the existing graph broke down at that scale. Controls competed for space with the graph itself, navigation aids were either missing or permanently on screen regardless of need, and there was no fast way to find a specific service or understand where you were relative to the rest of the system. Solution: The reframe was from "show every control, all the time" to "show the graph, and let controls earn their place on screen" — search, filters, a directional pad, and a minimap all still exist, but now appear based on what the user is actually doing rather than living in a fixed toolbar. Impact: This design was handed off for usability and QA testing, so what follows are concrete before→after design changes rather than tested metrics — toolbar actions cut from 8+ competing controls to the 7 that directly support finding, understanding, or navigating a service, and the graph promoted from a bounded dashboard card to a fullscreen-capable primary workspace.
The throughline: the real work was deciding which controls hadn't earned their place on screen, not making the existing ones prettier. Conditional UI — navigation aids that appear only once the graph's complexity justifies them — did more for the interface than any single new feature would have.
Problem, solution, and the impact being tested.
Problem
The graph in Specmatic Insights had to handle 100 to 5000 services, but the old design could show up to 24 at a time before it became unreadable. It maps how software's many small services rely on each other: in an online shop, checkout needs payment, and payment needs a fraud check. Each node is a service and each arrow connects it to one that uses it. As the graph grew, engineers couldn't find a service, follow the arrows, or keep their place, and so couldn't answer "if I change this, what could break?"
Solution
From "show every control, all the time" to "show the graph, and let each control earn its place." After team feedback on v1, I went further: scope the graph to the person looking at it, by team, with filters and a hover card that answers the questions engineers actually ask.
Impact
Design changes, handed off for testing, no measured results yet:
- 01Corner icons with no search and no service count → header with search and a service count, plus one bottom bar for zoom, fit, reset and fullscreen.
- 02Directional pad and minimap → conditional: pad only when zoomed in, minimap only above 150% zoom and 50 nodes.
- 03Graph card in a long dashboard → fullscreen-capable workspace with the same bottom navigation and a clear exit.
- 04Bare node name → hover card with Name, Exposes, Used by, Depends on, and colour-coded upstream and downstream edges.
- 05One wall of 100 nodes → two proposed entry flows to test: team-scoped from login or open with Team and Services filters.
The redesign, live.
The scale wasn't hypothetical.
- Product. Specmatic turns API specs into executable contracts. Insights is its visibility layer, and the graph shows who provides what and who consumes it.
- The graph. Built from CI/CD reports, so it shows logical contract relationships, not runtime traffic. Arrows run from provider to consumer.
- Users. Developers, architects, platform and QA teams, governance, SREs, managers and new engineers, all trying to find a service, judge a change's impact or get oriented.
- Why a redesign. The old limit of 24 readable nodes against a target of 100 to 5000 was the main reason. A visual refresh would not move it.
- What the product does. Specmatic helps engineering teams work with API contracts and verify that services actually communicate the way those contracts say they will. Insights is the visibility layer on top of that — and the Service Dependency Graph is the part of Insights that shows which services depend on which, a logical contract-relationship graph, not a runtime infrastructure map.
- Who relies on it. Not one type of user — backend/API developers, contract owners, platform engineers, architects, EMs, QA/test teams, DevEx/governance teams, SREs, and engineers new to a codebase all use this graph, each with a different job: find a service, assess blast radius, scope regression tests, understand ownership, or just get oriented in an unfamiliar system.
- Why the complexity is real, not invented. The intended scale is 100–5000 services with only ~12–24 visible at a time. That's not a hypothetical edge case — it's the baseline the graph has to work at from day one, which means "more services" reliably means "more relationships, more visual noise, harder navigation."
- Why this needed a redesign, not a visual refresh. The existing graph's problems weren't cosmetic. Nodes could exist with no visible relationships and no explanation why. The canvas didn't use its own space efficiently. Controls were permanently present regardless of whether the current view needed them. These are structural, information-hierarchy problems — repainting the same toolbar wouldn't have fixed any of them.
How the week ran.
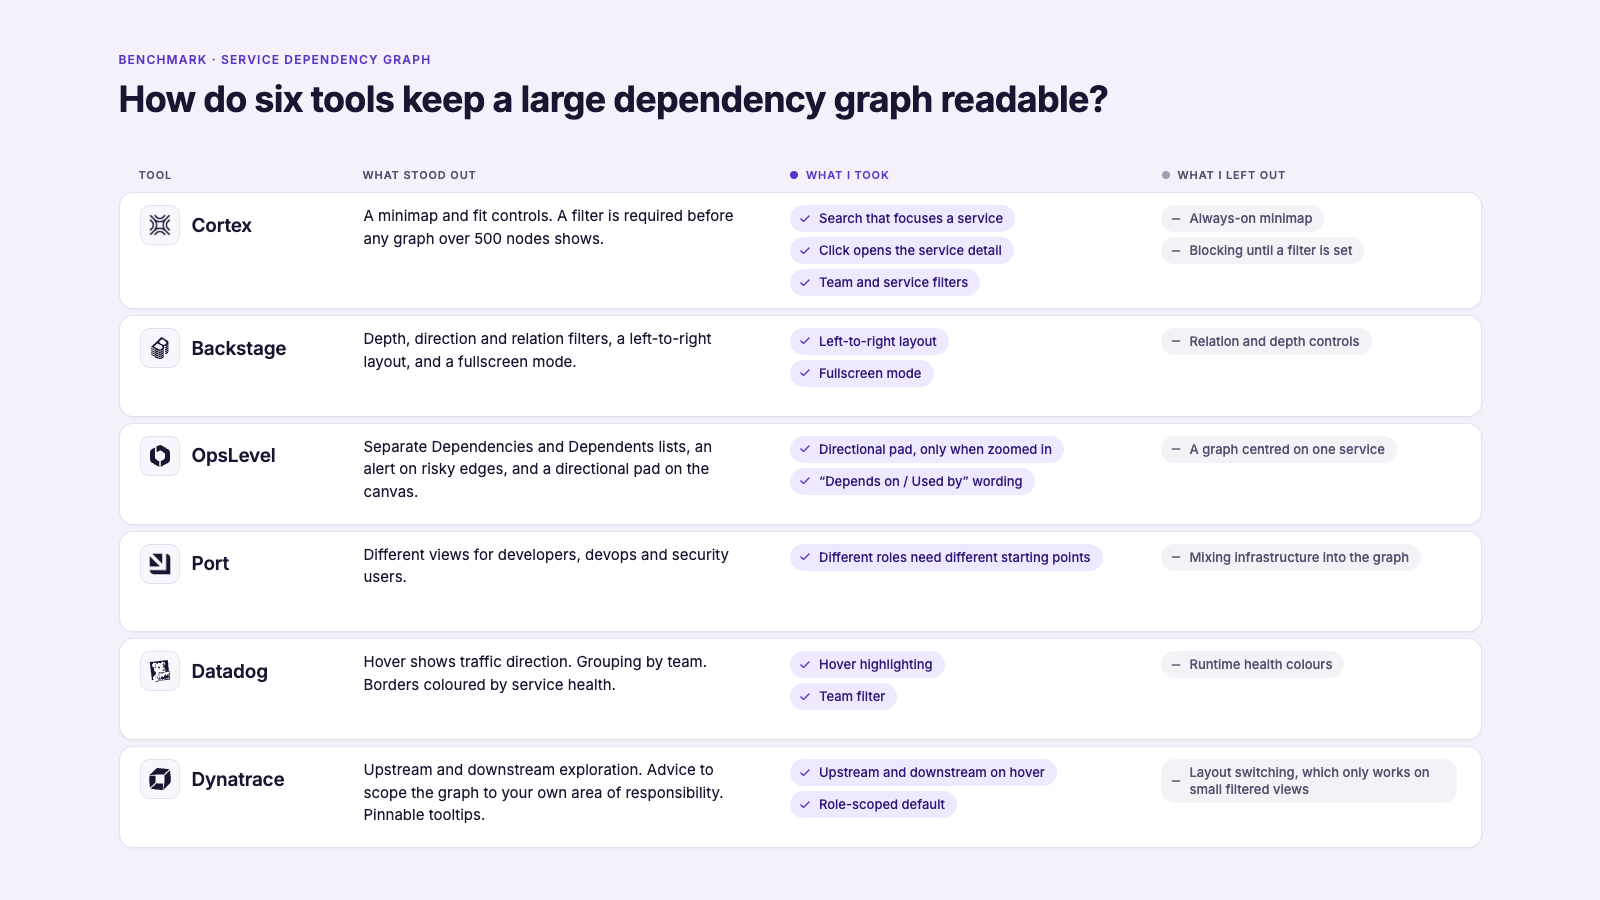
Benchmark: Cortex, Backstage, OpsLevel, Port, Datadog and Dynatrace, read for navigation and scale handling, not visual style.
Most of the tools handle a big graph by making you cut it down before you can read it: you pick a filter, set how many links to follow, or choose an area. That made me ask a different question: why start from the whole system at all?
Controls should earn their place.
- Before: No search and no service count. Only green circular icons in the corners: four directional arrows at the bottom left, zoom in, zoom out and fit at the bottom right, always on screen. Finding a service meant panning and reading node names.
- Reframe: Break the task into find, understand, move around, stay oriented, recover, then ask of every control: which step does this serve?
- Result: Header with search and the service count ("Showing 100 of 100 Services"). Corner icons became one bottom bar: zoom out, zoom in, fit, reset and a fullscreen toggle. Fit shows overall structure; reset returns to default. Search narrowed by about 20% during iteration so it is the fast path without dominating.
What the legacy approach made users do
The original graph toolbar carried a View dropdown, Previous and Next buttons, and an Export action — all competing for the same visual space as the graph itself, alongside search, filters, and the graph controls that actually mattered for navigation. A user opening the graph to answer "what does this service depend on?" had to visually filter out four controls that had nothing to do with that question before they could even start.
The obvious fix, considered and rejected
The easy move here would have been a visual refresh — restyle the same toolbar, tighten the spacing, call it done. That was set aside quickly: the problem wasn't that the controls looked cluttered, it was that they were cluttered with the wrong things. Restyling doesn't fix a control competing for space it hasn't earned.
The reframe
The real question wasn't "how do we fit these controls in more neatly" — it was "does this control directly help the user understand or navigate the dependency graph?" Anything that didn't clear that bar came out entirely, rather than being made smaller.
The result
View dropdown, Previous, Next, and Export were removed outright. What remained — total service count, search, zoom, fit, reset, filters, and the graph itself — earned its place because each one maps directly to a step in the actual user task (find → understand → navigate → orient → focus). Search was kept but narrowed by roughly 20%, sized as a fast path to a specific service rather than a dominant toolbar element. Filters were rebuilt as compact, canvas-anchored elements instead of a toolbar row, so the graph — not the chrome around it — stays the dominant visual element.
Removing a control outright is a stronger move than restyling it. The question isn't how to fit everything in more neatly — it's what hasn't earned its place at all.
When does a nav aid earn its space?
- Before: Directional arrows always on screen at any zoom; no overview at any zoom.
- Rejected: A permanent minimap. On small graphs it is a second layer nobody needs, and it takes canvas.
- Reframe: Not "should it exist?" but "when does an aid justify its space?"
- Result: The four-key pad appears only when zoomed in, above the bottom bar with Down under Up. The minimap appears only above 150% zoom and 50 nodes. The bottom bar stays put, so only the pad and minimap come and go. Small graphs stay clean.
What the legacy approach made users do
In the current build, navigation aids don't yet track the user's actual context. A directional control sits on screen at all times regardless of zoom level, and there's no minimap at any zoom level — so on a small graph the interface still carries navigation weight it doesn't need, while on a large, deeply-zoomed graph, there's nothing to answer "where am I relative to the rest of the system?"
The obvious fix, considered and rejected
The default pattern most graph tools reach for is a permanent minimap, always in the corner. That was ruled out — for a graph that's frequently small or simple, a permanent minimap is a second navigation layer the user doesn't need yet, and it takes up canvas space that could go to the graph itself.
The reframe
The guiding question became "when does a navigation aid actually justify the screen space it takes?" — not "should this feature exist," but "when should it appear." That produced two explicit, testable conditions instead of an always-on/never-on binary: the 4-key directional pad appears only once the user is sufficiently zoomed in, positioned just above the bottom toolbar with Down directly under Up so it reads as a deliberate controller, not a scattered set of arrows. The minimap appears only when zoom exceeds 150% and the graph has more than 50 nodes — the two conditions under which a user is genuinely likely to lose spatial context.
The result
Both aids go from either permanently present or entirely absent to conditionally available exactly when the graph's complexity justifies them — small and simple graphs stay clean, while large, zoomed-in graphs get the orientation support they need without that support existing as visual noise the rest of the time.
Conditional UI needs an explicit, testable threshold — not a vague "show it when it's needed." A fuzzy rule is unbuildable and unreviewable; zoom >150% and >50 nodes is neither.
An exploration mode, not a magnification setting.
- Before: The graph sat in a small card on a long dashboard page, so a graph of many services got only a small window.
- Rejected: Just make the card bigger. A bigger card still has no controls built for exploring and no clear way back to the dashboard.
- Reframe: Fullscreen should be a way of exploring, not just a bigger view.
- Result: A fullscreen toggle opens the graph across the whole screen with the same bottom bar (zoom, fit, reset) and an exit button. Closing it takes you back to the dashboard.
What the legacy approach made users do
The graph was bound by the surrounding webpage. Any real exploration — following a long dependency chain, comparing spread-out clusters — meant working inside a canvas that was smaller than the problem it was trying to represent, with no way to reclaim more space.
The obvious fix, considered and rejected
The straightforward version of "give it more room" is simply making the graph bigger — expand the card, shrink the surrounding page. That alone wasn't enough: making the canvas bigger without carrying navigation controls (fit, reset, zoom) and a clear exit path into that bigger view just relocates the original problem into a larger box.
The reframe
The distinction that mattered was fullscreen as an exploration mode, not a magnification setting. Going fullscreen needed to preserve every navigation aid the user relies on in the normal view — bottom navigation, fit, reset — and needed an unambiguous way back out, rather than trapping the user in an enlarged canvas with no clear exit.
The result
The graph now supports Normal webpage → Graph section → Fullscreen graph as a deliberate escalation path. The Insights dashboard context stays intact until the user chooses to leave it, and fullscreen carries the same bottom navigation and recovery controls (fit/reset) as the standard view, with an explicit way to exit back to the dashboard.
More screen space only helps if the controls and the exit path travel with it. A bigger canvas that strands the user is the same problem in a larger box.
Start from the person, not the system.
Team feedback on v1: show upstream and downstream clearly, colour-code dependencies, add a team filter, and give every node Name, Exposes, Used by, Depends on.
- Before: v1 helped you cope once lost. It did nothing to stop you getting lost in 100 services.
- Rejected: Blocking the graph until a filter is set, as most benchmarked tools do (Cortex requires one above 500 nodes). It gates the graph and fails for a new engineer who does not know what to filter by.
- Reframe: If login already brings team data, why start from the whole system? Start from the person.
- Result: Two flows, both requiring login, proposed for side-by-side testing:
- Flow A, scoped default: the graph opens as your team's services, with a "Show all services" button. Search reaches every service.
- Flow B, open default: the full graph with Team and Services filters. Selecting two services tags a shared downstream "Used by both".
- Hover and click: hover opens the four-field card; edges turn blue for what it depends on and orange for what uses it; the rest steps back. Click opens the existing service detail, so no second place for the same information.
A side panel the product didn't need.
My v1 had a side panel with team, dependency counts and a health status per service. The team's feedback pointed out that the panel was not a functionality of the product. The product has no health status on services, and clicking a service already opens a detail view. I took it out, moved the four facts onto hover, and rebuilt around what the product actually does.
Craft lessons, and one deeper one.
Craft lessons
- Removing a control beats restyling it. Ask "does this help the task?", not "how do I fit this in?"
- Conditional UI needs a testable rule: "above 150% zoom and 50 nodes" can be built and reviewed; "when it's needed" cannot.
- Not getting lost beats tools for being lost. The scoped default was the biggest change from v1 to v2.
One deeper lesson. A design only holds if it is checked against what the product really does. My side panel looked right but assumed data that did not exist. Now I check ideas against the real product and data before they reach the team.
What's next. The design is with engineering for testing. Open questions: which flow gets people to a service faster, and how login team data maps to services.